
The E-Commerce Data & AI Layer Your Stack Is Missing
Marketing is measured to the decimal. The rest of your business runs on guesswork. Anlytic builds the data and AI layer that turns your existing tools into decisions you can make in minutes, not weeks.
A sharper operating view for commerce teams.
One platform connecting your commerce stack. Every margin gap, return spike, and retention signal reaches the right team before the window closes.
The gap
The clarity stops at the edge of marketing.
Your data is spread across tools that don't talk to each other.
Shopify shows units sold. Triple Whale shows ROAS. Stripe shows what actually cleared. Xero shows margin once COGS and returns land. Every cross-functional question turns into a reconciliation exercise before it becomes an answer. By the time the picture is complete, the moment has passed.
Real world application
Immediate Real World Application
Each operating view connects the tools you already use into a single, queryable layer so the answer arrives before the next budget, stock, or retention window closes.
You know ROAS. Now see true margin.
Your Meta dashboard shows 4x ROAS. Your agency reports the same. But ROAS does not account for COGS, returns, shipping, or platform fees, so spend decisions can scale a campaign that does not actually make money.
Business impact
At $50K/month in spend, a 4x reported ROAS that is actually 1.8x net contribution means you are scaling a loss.
How Anlytic solves it
- Connects ad spend, Shopify revenue, COGS, returns, and fees.
- Shows true contribution margin beside platform ROAS.
- Answers margin questions in plain English.
Catch return risk before spend compounds.
A campaign running at 4x ROAS looks like a win. If it is also driving a 35% return rate, it is not. Returns data does not surface at campaign speed, so spend keeps scaling after the signal has turned negative.
Business impact
Two weeks of scaling before returns surface can mean $25K in spend pushed into a campaign that was never profitable.
How Anlytic solves it
- Connects returns directly to campaign performance.
- Fires alerts when return rate crosses threshold.
- Shows ROAS and return rate together before scale decisions.
Own the baseline behind your marketing numbers.
Most founders relying on an agency see one set of numbers: the agency dashboard. Attribution windows are configured outside the business, and there is no independent baseline for actual revenue and profit.
Business impact
A 20% gap between reported and actual ROAS on $30K/month in managed spend creates $72K/year in decisions made on a number the business did not control.
How Anlytic solves it
- Pulls directly from ad platforms and Shopify.
- Compares agency ROAS to direct-source contribution.
- Gives leadership an owned baseline without interrupting execution.
Retention Monitor · Cohort Health
| Cohort | Repeat Rate | Threshold | Status | Action |
|---|---|---|---|---|
| Q1 New Customers | 41% | 35% | Healthy | — |
| TikTok Acquires — Mar | 17% | 30% | At risk | Win-back queued |
| Meta Retargeting — Feb | 28% | 30% | At risk | Excluded |
| Email VIPs | 62% | 50% | Healthy | Flow sent ✓ |
When repeat purchase drops 5 points, prepare recovery
Email VIPs triggered in week 1 — typical discovery is week 6. Win-back flow activated.
See churn signals while there is still time to act.
Repeat purchase rate and cohort LTV determine whether growth is compounding or leaking. If the decline only appears in a weekly or monthly report, the recovery window is already closing.
Business impact
At a $30M brand, catching a 5-point repeat-rate decline at week six instead of week one can leave roughly $260K in recoverable revenue untouched.
How Anlytic solves it
- Monitors cohort repeat purchase continuously.
- Alerts when a segment drops below threshold.
- Triggers win-back, audience exclusion, or team notification.
Who it's for
Three faces of the same problem
Founder / CEO / COO
“I know my marketing numbers. I don't know what they mean for stock, cashflow, or where to push next.”
What Anlytic does
One unified view across sales, marketing, finance and ops. Plain-English questions get board-ready answers in seconds, not days.
CFO / Head of Finance
“Marketing says we should spend more. I can't approve it because I can't see the actual margin contribution. We're not arguing about strategy. We're arguing about which spreadsheet is right.”
What Anlytic does
Connects marketing performance to real financial outcomes. So finance and marketing argue about strategy instead of numbers.
The Accidental Data Owner
“Every team comes to me. Marketing wants attribution, finance wants margin, ops wants to know which products are bleeding cash. I'm the one pulling spreadsheets, and I still can't prove what I already know.”
What Anlytic does
Anlytic unifies the data layer so the business can self-serve. The Accidental Owner stops being the bottleneck, and what they already know about the business is finally something they can prove.
Where the money leaks
E-commerce teams have spent a decade perfecting marketing measurement. ROAS, attribution, channel performance. The stack is mature. What's missing is everything beyond it. Stock levels, COGS, supplier lead times, fulfilment costs, cashflow. These live in different tools, different spreadsheets, different teams. The decisions that move the P&L get made on stale or partial data.
Impact
What Retail Teams Gain
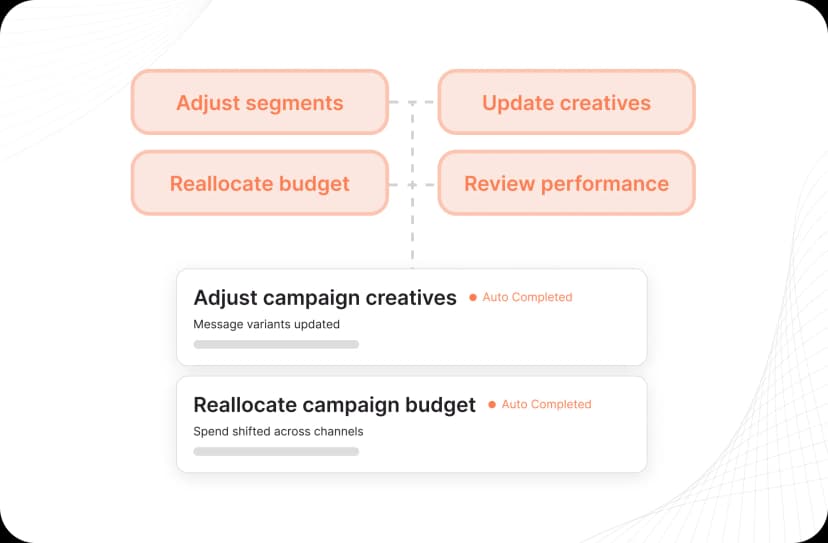
Less Manual Campaign Management
Reduce the time spent adjusting segments, creatives, and budgets.
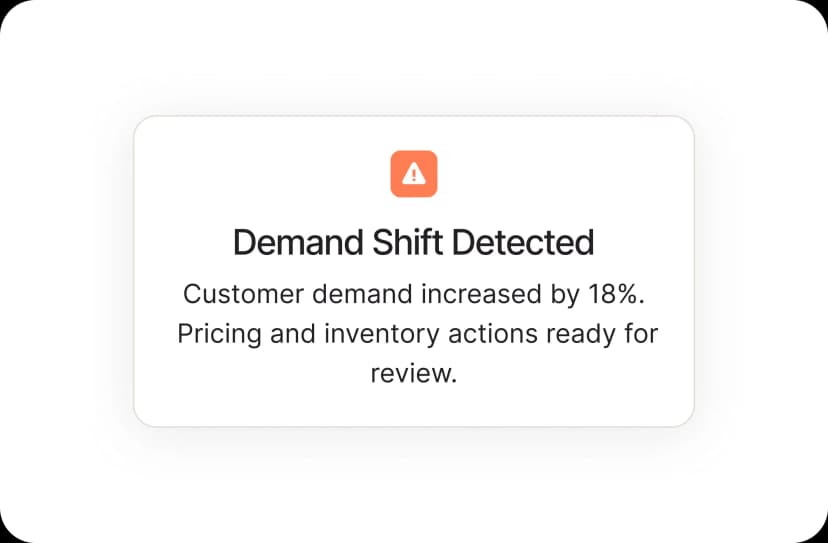
Faster Response to Demand Changes
React to customer behaviour as it happens, not days later.
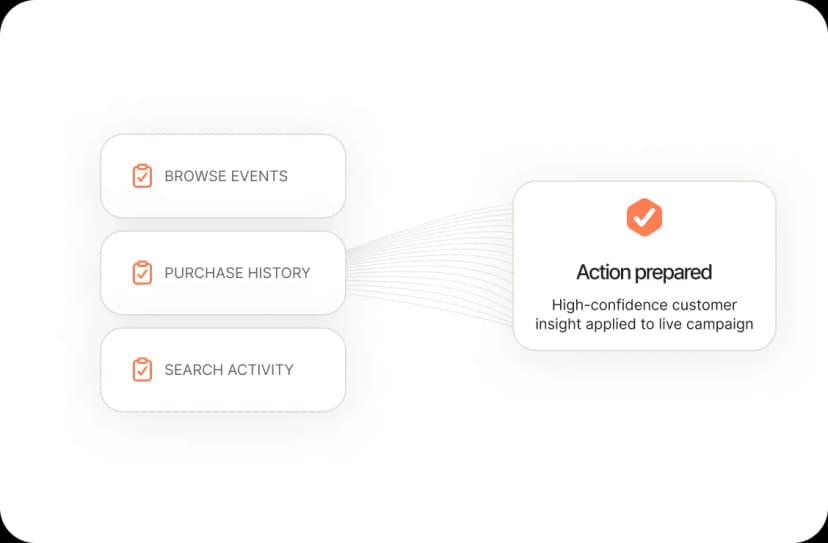
Better Use of Customer Data
Turn signals into action instead of static reports.
Higher Team Efficiency
Free teams to focus on strategy, testing, and growth.
What you get
Decisions in minutes. Not end of month.
Your operations already generate the data. Anlytic turns it into action.
True margin, by product, daily
Stripe fees, returns, COGS, all baked in. Finance and marketing argue about strategy, not which spreadsheet is right.
10–20%
Lift in marketing ROI
Stock aligned with live demand
Inventory, sales velocity, supplier lead times in one model. Stockouts go down. Working capital frees up.
Up to 65%
Reduction in stockouts
Plain-English answers, in seconds
Anyone in the business can ask anything. No analyst in the loop. No ticket queue. No waiting.
2–3x
Faster revenue growth
The bottleneck disappears
Your operators stop pulling spreadsheets and start shaping strategy. You don't need to hire a data team to get there.
Common questions
Objections we hear, and how we answer them
“We'll build this ourselves with Claude / AI.”
Building a chatbot over scattered data isn't the same as building a unified, governed, reliable data layer with AI on top. The AI isn't the hard part. The plumbing underneath is. Anlytic is what you'd build if you had two years and a team of engineers. Already built. Already running.
“We've already invested in our existing BI stack.”
Most existing BI stacks are reporting tools. They tell you what happened, not what to do next. Anlytic sits on top of this infrastructure, eliminating the need for a data analyst by letting anyone ask questions in plain English and immediately get data-backed answers, drastically shortening the time from question to action.
“Unified dashboards have been tried and failed. Specialists want their own tools.”
Agreed. And that's why we're not pitching a dashboard. Specialists keep their tools. Anlytic is the layer that makes the data behind those tools talk to each other, so cross-functional decisions don't break down at the seams.

Get Started
Bring one messy commerce question.
We'll show how Anlytic turns the tools you already use into answers your team can act on before the next budget, stock, or retention window closes. Book a 30-minute discovery call.